About a month ago we saw “yield curve inversion signals incoming recession!” plastered on financial headlines. Between then and now a lot of articles have touched on the specifics of yield curve inversions and given a refresher on what exactly they are. There are some really good ones out there, like this one from Market Sentiment.
In a nutshell, a yield inversion is where longer-term bonds have a lower annual interest rate than shorter ones. This is backward from how it’s normally supposed to be, where shorter bonds have lower yields. The reasoning behind this is simple. A longer time frame means more uncertainty, or in other words, more risk. More risk results in a higher interest rate for investors. A yield inversion happens because investors think that there is actually less uncertainty in the long term than there is in the immediate future. In this last yield inversion, the only two bonds that flipped are the two and ten-year terms.
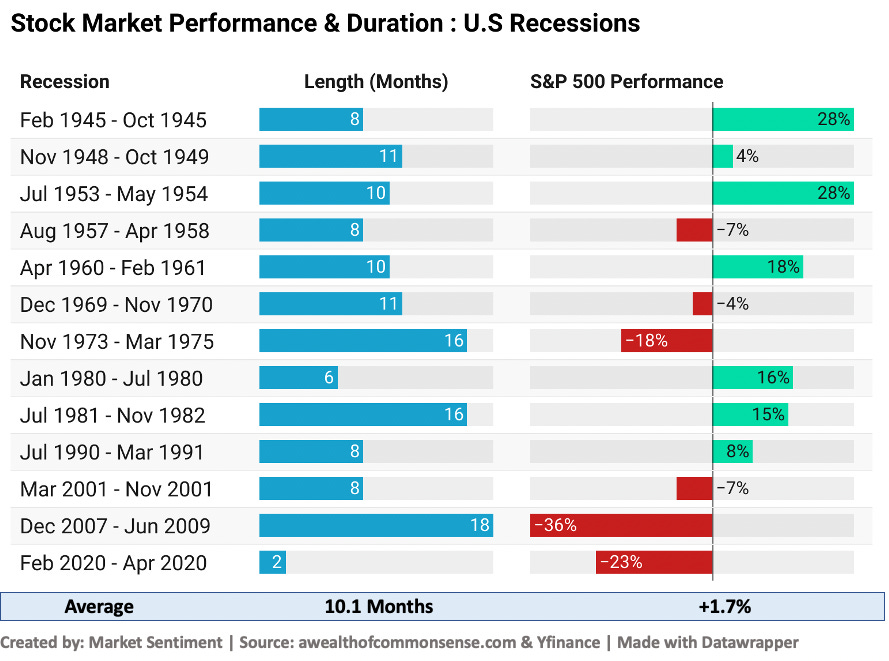
That’s a quick rundown of what a yield inversion is, but we’re not really interested in what exactly a Yield Curve inversion is, or what it signifies specifically for the near future. Today we are going to focus on whether we can use this yield curve inversion to time the market and whether this can increase our returns. According to Market Sentiment’s article, there have been four previous yield curve inversions of the 2 and 10-year Treasury bonds. The recessions that followed them started anywhere from 5.8 to 22 months after the inversion date.
The Burning Question On Our Mind:
How can we use this data to our advantage? Is it even possible to use this data to our advantage? We know that recessions cause stocks to slump, and we also know the average length of a recession is about 10 months.
Perhaps if we use the yield inversion date, we can approximate the time to enter a full-on market crash.
This chart from Tradingview shows that the 2 and 10-year treasury yields have inverted 8 times since 1977.
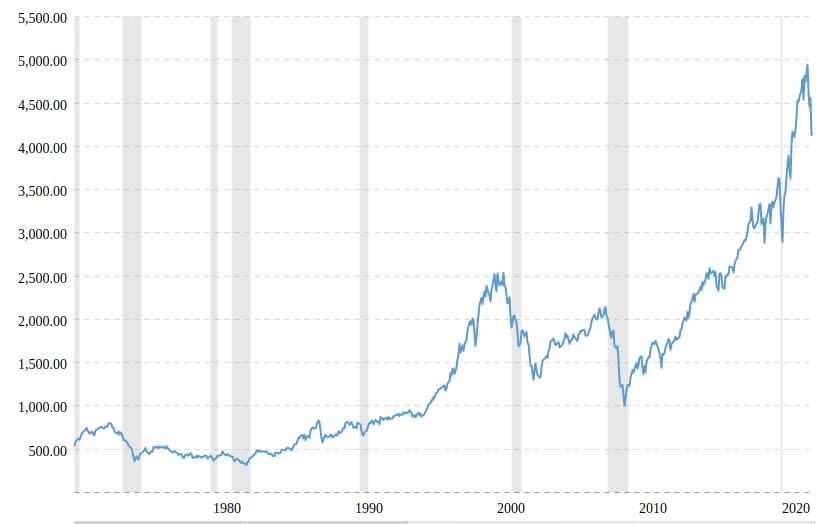
And looking at the S&P 500 chart we can see that the market has gone into a recession six times since 1977. The one odd duck in the dataset is the crash of 1987 which did not have any yield inversion preceding it.
One of the charts above gives the dates from yield inversion to market peak. However, we’re more interested in the time until the market bottom. So let’s take a look.
Aug 1978 - May 1980 21 months
Sept 1980 - July 1982 22 months
Jan 1982 - July 1984 30 months
Dec 1988 - Oct 1990 22 months
May 1998 - Sept 2002 52 months
Dec 2005 - Feb 2009 38 months
Aug 2019 - Mar 2020 7 months
Mar 2022 - ?????
Average Number of Months From Inversion To Market Bottom: 27.43
Median Number of Months From Inversion To Market Bottom: 22
Both the mean and the median time from yield inversion to market bottom remain within a 1-3 year range. That’s pretty wide, and not particularly useful. So maybe instead what we can do is measure the probability that we will miss out on significant future gains by pulling out of the market for one to three years after a yield inversion.
But first, we’ll check the results of a portfolio that weathered the time from yield inversion through the crash, versus one that managed to perfectly nail the bottom of the market (which is impossible in practice) just to see how much of an edge we are dealing with had you been able to catch the exact bottom.
The Historical Performance of Inversions:
Sadly, using Portfolio Visualizer only gives us access to S&P 500 data starting from 1985. So we will miss out on the data from the three previous inversions and crashes. However, that leaves us with three other data points spread over a period of 30+ years and two more that we have not seen fully play out yet.
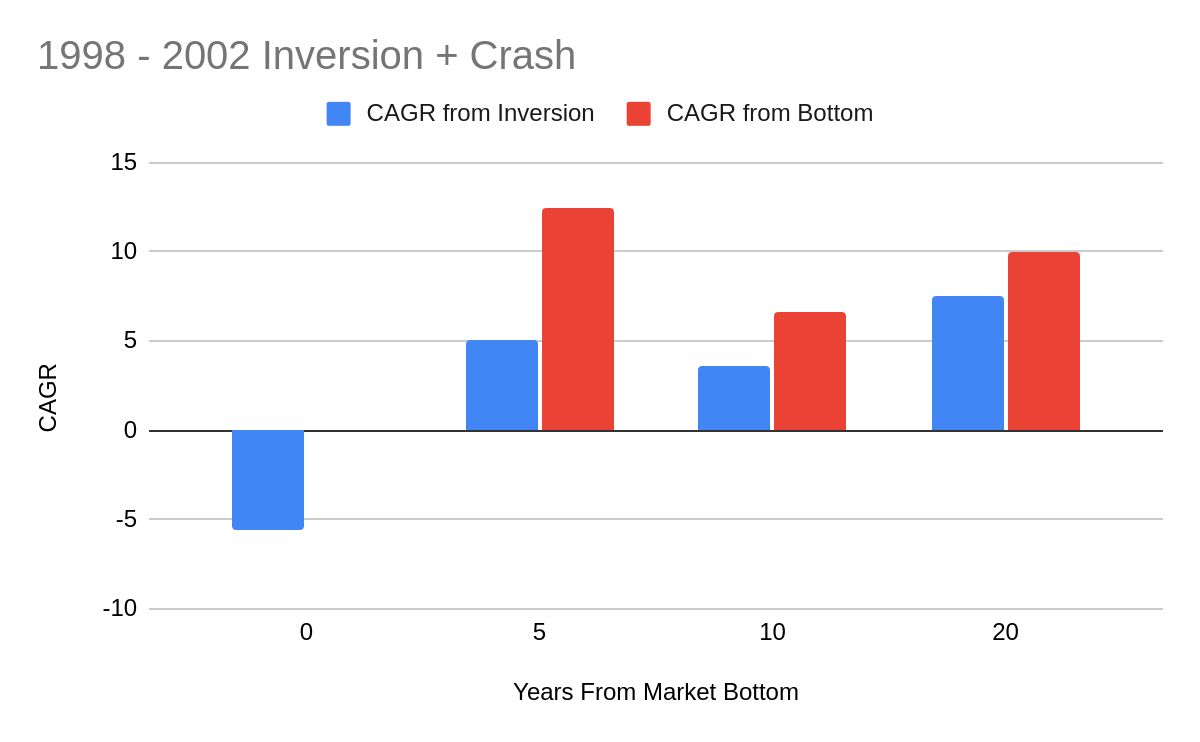
In the first inversion and crash, we can see an outperformance by investing at the bottom of the market. However, it’s not near as much as you would expect from investing directly at the bottom. Five years after the crash the CAGR from the bottom is just under 2% higher than if we had just weathered the crash. By year twenty there is no discernable difference, in fact, buying at the bottom of the market underperformed!
In this case, the 1988 inversion might be an outlier because in all of the other instances the margin of outperformance is larger.
But still, across all of these charts, there is a noticeable trend that outperformance by buying at the bottom decreases over time. Under no circumstances did the gap actually increase. My intuition says that this is most likely because markets have a mean-reverting nature when it comes to their return.
This can be demonstrated by some simple math, let’s say hypothetically that 90% of the time the market return is 10%. The other 10% of the time the market returns range from +30% to -30%.
If at the beginning of a 10-year period we experience a 30% decline in the market then statistically it is likely that the other nine years will have a 10% return.
We can take a look at this in an investment calculator and a CAGR calculator to see that the returns and account value look as follows:
Year 1: $7000 CAGR: -30%
Year 2: $7700 CAGR: -12.25%
Year 3: $8470 CAGR: -5.38%
Year 4: $9317 CAGR: -1.75%
Year 5: $10,248.70 CAGR: 0.49%
Year 6: $11,273.57 CAGR: 2.02%
…
Year 10: $16505.63 CAGR: 5.14%
As you can see, over time the initial 30% dump matters much less on the overall return (even though from an account value standpoint, it could mean a difference of hundreds of thousands of dollars, but even then, those hundreds of thousands make up a fraction of the entire account size).
This aforementioned phenomenon explains this graph:
So pretty much, if we want to profit from a yield inversion, we would literally have to predict the exact bottom of the market. AND even if we did that, the historical performance shows that we still might end up behind.
But just as an experiment, let’s see how much of an edge we lose by being a couple of months off of the bottom of the market when we buy.
Now I’ll just be upfront, when making this article I wasn’t expecting these results because they contradict the case that we’ve been building up to this whole time.
If you are able to get within 10 months of the market bottom, (either before or after) the worst you can do is beat the market by 1% annually. This holds up even out to the twenty-year threshold. Which according to our investment calculator, amounts to about a 19% bigger nest egg.
But…
This is not as generous as it seems. Say you make a compromise between the median and mean number of months from the inversion to the market bottom (about 25 months).
You wait for an inversion and then pull all your money out of the market. You do this for 25 months regardless of the current market climate before reinvesting…
Only four out of the seven times in the last forty years would you have been within the range. That’s barely better than a coin toss!
What does this mean for you and me? Inversions are not the gold mine that I thought they were. I know it sounds like a cliche, but this whole exercise pretty much managed to prove the old mantra.
Time IN the market is better than TIMING the market.
I would love to hear your thoughts on this topic, you can leave them in the comments below and I will respond to all of them. And by the way, if you enjoyed this article, please consider subscribing and sharing it. It’s completely free and will only take a moment. We will never send you spam, and send out one high-quality post a week, so sign up to get notified!
Disclaimer:
All content is for discussion, entertainment, and illustrative purposes only and should not be construed as professional financial advice, solicitation, or recommendation to buy or sell any securities, notwithstanding anything stated.
There are risks associated with investing in securities. Loss of principal is possible. Some high-risk investments may use leverage, which could accentuate losses. Foreign investing involves special risks, including a greater volatility and political, economic and currency risks and differences in accounting methods. Past performance is not a predictor of future investment performance.
Should you need such advice, consult a licensed financial advisor, legal advisor, or tax advisor.
All views expressed are personal opinion and are subject to change without responsibility to update views. No guarantee is given regarding the accuracy of information on this post


Interesting analysis... Quite a counterintuitive result!