


How We Can Profit From Market Inefficiency...
One of Warren Buffett's oldest tricks


Welcome back folks to this week's edition of Premium Income Investments! We hope you’re looking forward to more investing-related content because that’s what we’ve cooked up!
This week we are taking a look at liquidity and its effect on returns.
But first…
What’s Liquidity?

Liquidity is the term we use for how easily an asset can be exchanged in the marketplace.
A marketplace with a hundred buyers and sellers each is much more liquid than a market with only five buyers and sellers because they are much more likely to agree on a price with which they can exchange their assets.
So Why Exactly Is Liquidity Important For Our Return Profile?
Well, you may recall that I’ve talked about something called the Efficient Market Hypothesis (EMH) in previous posts, this basically is just the idea that all available information about a stock has been incorporated into its price, and therefore it is impossible to beat the market other than by dumb luck.
Liquidity plays a very important role in this process by facilitating market efficiency. The more people with their eyes on a market and willing to exchange, the less likely it is that there can be large price discrepancies or inefficiencies.
This partly explains why people don’t object to the possibility of making 20% year-over-year returns on real estate or small businesses. The markets for both of these are much more fragmented and have fewer people combing them for good deals.
To some extent, we may be able to see this effect play out in the stock market on more thinly traded securities.
So as always, our question becomes, can we use this to our advantage to beat the market?
What Does The Data Say?
According to an article put out by CBS News, liquidity does have a correlation with overall returns. There is no “free lunch” but there is a risk premium offered by stocks with low liquidity.
The authors explain that the source of the higher returns comes not only from compensation for taking liquidity risk, but also from stocks "migrating" between liquid and less liquid (just as stocks migrate from small to large and value to growth, and vice versa). For example, they found that in the lowest liquidity quartile, only 74.9 percent remain a year later, with 25.1 percent moving to higher liquidity quartiles.
As stocks migrate to higher liquidity quartiles, they earn dramatically higher returns, and vice versa. For example, 70.9 percent of stocks remain in the most liquid quartile during the next year. As the remaining 29.1 percent drop into lower quartiles, they actually earn negative returns (as investors demand higher risk premiums as compensation for the greater liquidity risk). Less liquid stocks migrate toward more liquid quartiles while more liquid stocks migrate toward less liquid quartiles.
The excess return generated by a portfolio that purchases low liquidity stocks and shorts high liquidity stocks was 0.50% a month. Even a portfolio that only purchases low liquidity stocks generated monthly alpha of 0.20%.
That’s an extra 2.4% to 6% a year on your stock portfolio!
Not only this but it was also found that there was a difference when accounting for firm size.
They also found that the liquidity premium holds regardless of market capitalization (size). However, the liquidity effect is the strongest among micro-cap stocks and declines from micro- to small- to mid- to large-cap stocks:
Across the micro-cap quartile, the low-liquidity group earned a geometric average return of 18.2 percent a year in contrast to the high-liquidity group returning 6.2 percent a year.
Across the large-cap quartile, the low- and high-liquidity groups returned 12.5 percent and 9.9 percent respectively, producing a liquidity effect of 2.6 percent.
Within the two midsize groups, the liquidity return spread was also significant.
That said, there have been funds that attempted to capture this liquidity premium and failed. A notable example is Long Term Capital Management which had a total return of 144% in only three years. However, with the collapse of the world’s major financial markets, their fund cratered and lost 4.6 billion while being leveraged at 25 to 1.
Another study was interested in finding out whether the “liquidity premium” is actually a liquidity premium, or rather a size premium (a premium given for investing in small-cap companies.) Both of these factors seem closely intertwined so it’s important to know which one is actually doing the heavy lifting on the total return picture.
To do this effectively they used the Chinese stock market which had coexistence of tradeable and non-tradeable shares. This allowed them to separate the size factor from liquidity when looking at returns.
We find that the size of nontradable shares is negatively related to expected stock returns after controlling for several common liquidity measures such as turnover rate, trading volume and liquidity ratio, as well as the size of tradable shares. This is in sharp contrast to the results of several previous studies and indicates the existence of a pure size effect independent of liquidity.
They conclude that there is evidence to suggest that the size premium and liquidity premium are somewhat independent of each other. If a company is very large and has low liquidity it will have a higher average return than one of the same size but with higher liquidity. The same applies to smaller companies. This seems to agree with the previous data from CBS that the liquidity premium is more pronounced on smaller stocks (which is more likely due to the combined factors of size and liquidity than just liquidity alone).
So Now What?
We want to know what the beta and alpha are for low liquidity stocks. Is it simply more risk for more return? Or is it actually less risky than if we leveraged up with an index fund?
Beta and Alpha? What’s that?
These are pretty standard quantitative finance terms. Essentially Beta measures the price volatility of an asset compared to a benchmark.
For example, if Tesla stock on average moves 10% while the benchmark moves 5% the beta of Tesla stock is 2.0.

On the other hand, we have alpha. Alpha measures the return after accounting for stock volatility (or beta). If we have a stock with a beta of 0.5 compared to a benchmark we would expect that the return is half as much as the benchmark. However, this is not always the case. If the return is the same as the benchmark with a beta of 0.5 we have effectively generated alpha.
: Formula in Investments and Portfolio Management")
Going back to our example with Tesla with a hypothetical beta of 2.0, if the benchmark returns 10% the expected return for Tesla would be 20% for an alpha of 0%. However, if Tesla’s return was 25% with a beta of 2.0 our alpha is now 5%. Likewise, if Tesla had a return of 15% then our alpha is -5%.
With those two concepts under our belt, we now can evaluate this portfolio effectively. We are hoping for either a lower beta than the benchmark with similar returns or a higher beta with even higher returns than what we would expect. In either case, we can leverage or deleverage the portfolio to achieve a specific return profile.
First, we’ll take a visit to finviz.com and use their free stock screener to quantitatively find low-volume stocks.
For our screener settings, we are looking chiefly for low-volume stocks with under 100k shares traded per day. We want the company to be old (20+ years), mid-cap size, PE under 20, and PB under 2.
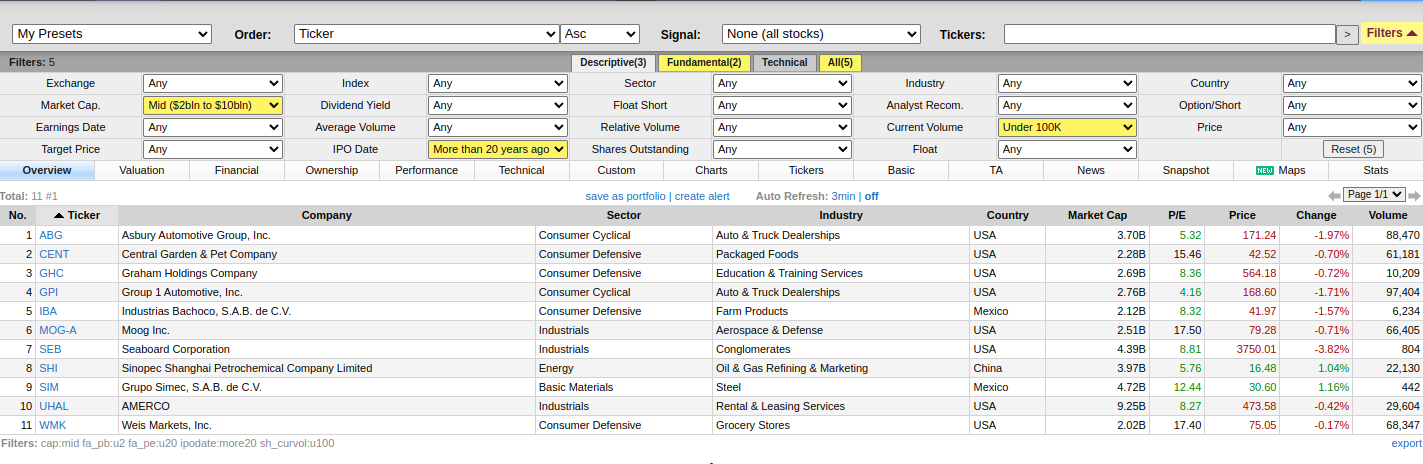
When we input the first ten of these companies into an equal weight portfolio on portfoliovisualizer.com backtesting software we get a surprising result.

Our low volume portfolio outperforms with an 18.51% annual CAGR! If we compare this to our S&P 500 portfolio’s 9.8% annual CAGR we are nearly doubling our annual returns. This is kind of an absurd result, so I tested it over four separate 5 year periods since 2002. In 3 of the 4 periods, there was a significant outperformance. The only period where it underperformed was from 2017 to 2022 when it underperformed by about 4% a year (S&P 500 performance was 11.88% whereas the low volume portfolio was 7.72%).
To some extent, I wonder if there is an additional variable we are not accounting for. Diversification provides a fairly significant change to the return of a portfolio.
However, that effect only matters up to a certain point. Generally, it is agreed that beyond 20-30 stocks in a portfolio there is virtually no decrease in volatility.

So if we increase the number of low-volume stocks in our portfolio to twenty what happens to our returns?

We still have outperformance, but we can see that just over 5% of our annual returns just vanished into thin air! This is probably due to our increase in diversification which makes a more apples-to-apples comparison to the benchmark. Our risk-adjusted return is still higher than the index, although not by a lot.
If we do our five-year period test again as we did with the last portfolio we get similar results. The low volume portfolio outperforms in 3 of the 4 periods with the period between 2017 and 2022 being the worst.
There are a few caveats to this though which I want to make clear. These could affect whether this low-volume strategy is actually good.
The process I used to select these stocks suffers from selection bias. It doesn't account for companies that have gone out of business through the years, and it also doesn’t use PE ratios, volumes, and other factors that we used to make our choices from historical data. It uses the data that was available to us today. This may or may not have a significant impact on our results.
It has a “value” bias. It tends to underperform during periods of high growth, and fair much better through flat or bear markets. If that is something you are willing to trade for, great! This might be a good fit.
Overall I think there is definitely some alpha here in low-volume stocks and should warrant more investigation by us and you as investors. After all, who doesn’t want a higher annual return?
But with that said, this brings us to a close for this week. If you enjoyed this article please consider subscribing or sharing with a friend, it just takes a couple of clicks and really helps me out, I would really appreciate it.
Until Next Time!
All content is for discussion, entertainment, and illustrative purposes only and should not be construed as professional financial advice, solicitation, or recommendation to buy or sell any securities, notwithstanding anything stated.
There are risks associated with investing in securities. Loss of principal is possible. Some high-risk investments may use leverage, which could accentuate losses. Foreign investing involves special risks, including a greater volatility and political, economic and currency risks and differences in accounting methods. Past performance is not a predictor of future investment performance.
Should you need such advice, consult a licensed financial advisor, legal advisor, or tax advisor.
All views expressed are personal opinion and are subject to change without responsibility to update views. No guarantee is given regarding the accuracy of information on this post