


BEATING THE ASIAN MARKETS

Welcome back everyone! Hope you had a wonderful week!
But before we continue, let me introduce you to InvestorSnippets. InvestorSnippets is a free daily newsletter which aggregates and summarizes a few important articles from big news outlets on stocks, ETFs, and markets. The newsletter can be digested in as little as two minutes if you read just the summaries, or if you want more information you can read the full article which is linked in the newsletter.
You can take a look at their most recent newsletter here if you want to see whether it’s your style.
Anyway! Let’s dive into today’s post!
This week, as I was thinking about an interesting topic about this week’s post, I was hit with an epiphany.
We haven’t ever talked about technical analysis.

I know I know. This is ridiculous right? Technical analysis is just astrology for investors isn’t it?
Well, maybe it is or maybe it isn’t. Why don’t we take a look today and see? Granted, this won’t be the end all be all on the topic given that there’s a wide range of concepts that fall within “technical analysis.” But, hopefully we can get at least some insight.
why Asian markets?
I’m glad you asked. The reason why is because I stumbled upon this research paper specifically targeting Asian markets and the effectiveness of technical analysis. Sadly, the paper is locked behind a paywall, but for anyone that wants to take a look at for themselves shoot me an email at premiumincomeinvestments@substack.com and I can send you the full PDF version of the paper for free.
Anyway, I’ll be touching on the important parts of the paper in this post anyway, so it won’t be necessary for reading this post.
First off, for the uninitiated, what is technical analysis?
Technical analysis assumes that past statistical stock data is important for what is happening now or in the future.
Now as we covered in the past article, hardcore efficient market hypothesis proponents will think that this is baloney. If the data is publicly available to all, it inherently becomes worth less because it gives more people the chance to “price it in” or make the markets more efficient.
And because of this, technical analysis is shunned by the investment community at large with the exception of self proclaimed stock trading gurus and some other niche communities. So now our question is, is this assumption unfounded?
One more aside before we start, just so we’re completely clear. The technical analysis in this paper is primarily concerned with mathematical models or formulas that result in a chart looking like this:

The other side of the coin is more “subjective” technical analysis which is not based on mathematics but more so how the chart “looks.”

Anyway, now that we’re clear let us resume.
The paper looked at 39 different Asian countries and measured the average buy and hold gain as a benchmark against the technical trading rules. The measured time period was from 2011-2018.
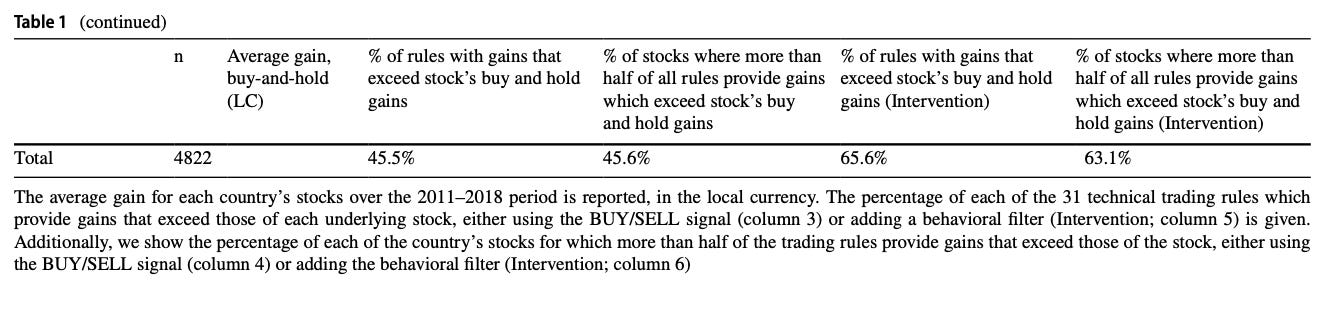
Interestingly enough, the average effectiveness of the 31 technical trading rules selected for this study across all the countries studied sits around 45%. The study used four different indicators (Moving Average, Relative Strength Index, Stochastic Oscillator, and Stochastic Oscillator Moving Average) with different variations in the parameters for each.
The specifics on which indicators were most effective can be seen in the table below.

The effectiveness of the rules also highly depended upon which country’s stock market they were used on. Nepal and Iraq for instance had a supermajority of trading rules that were able to outperform the buy and hold strategy.
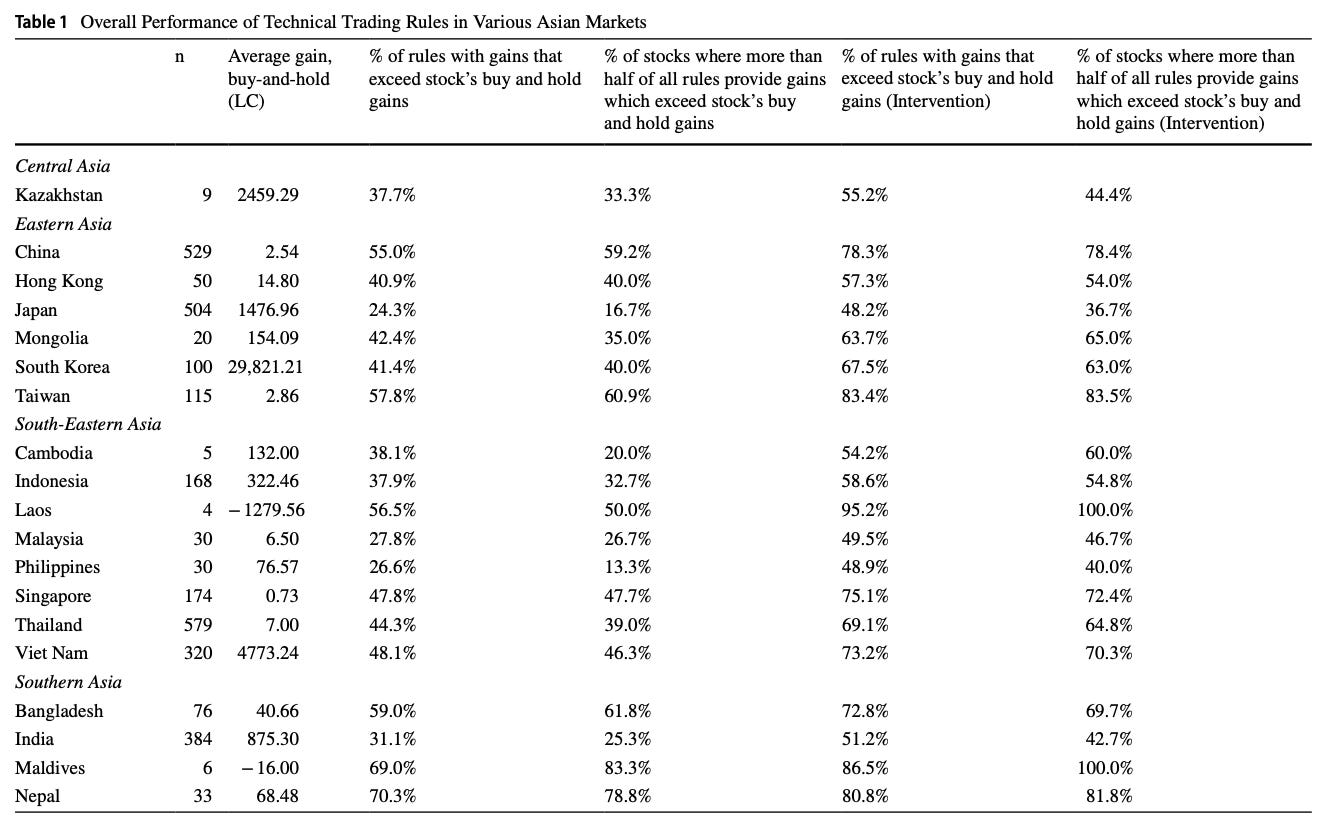
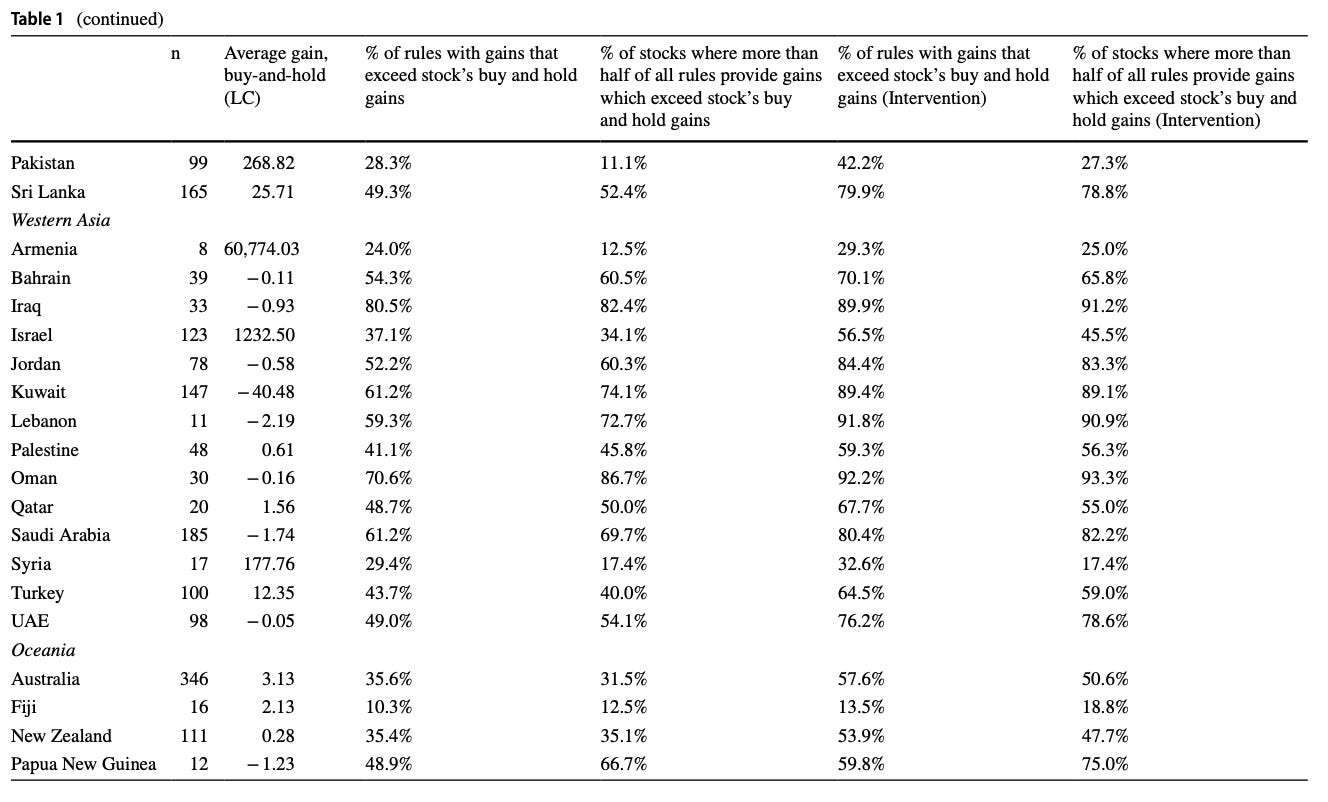
What we can extrapolate from this (at least for Asian countries) is that the Stochastic Oscillator Moving average has the highest effectiveness for outperforming buy and hold closely followed by the regular moving average. This trend was found to be true irrespective of the country it was traded in (It may have been the worst performer in a specific country, but on the whole was better than the alternative trading rules).
Takeaways:
So of course, this study sounds good, but sounding good and actually being good in practice are two separate things.
The first thing, and probably the most obvious is the applicability of this data to us as investors. Since most of my reader base resides in North America giving advice on which Asian countries to invest in is probably not terribly helpful. There are ways to invest in individual stocks in foreign countries through ADRs but the process might be more work than its worth.
So really, we need to apply this knowledge to the markets that we are familiar with, namely, the US stock market.
The thing that really jumped out to me when looking through this paper was how the viability of technical analysis differed so much from country to country. Take Fiji for example, only 10% of the technical trading rules exceeded the returns of the buy and hold strategy.
Contrast this with Iraq where 80% of the trading rules exceeded buy and hold.

Not all markets are created equal, some lend themselves towards statistical methods more than others. Whether that is because of a lack of market efficiency or some other reason is not evident, but it is clear that something is affecting it.
In the US market we could see this same thing except across different sectors or different time periods. (As one example of this, when the stock trader Jesse Livermore was still alive it appeared that the effectiveness of technical analysis was far superior to anything we would see now.) The paper even mentions that the Relative Strength Indicator (RSI) was able to outperform buy and hold in the Australian markets as recently as 1996-2014.
So before dismissing technical analysis, or some other method, perhaps it would be better to try isolating the method on one specific aspect of the market to see if we see any change in returns.
Now the second thing that got me thinking is, well obviously successful technical indicators would be skewed towards markets in which returns are flat or negative since beating buy and hold in this case would not be a high bar.
And to some extent, we do see that. In the previous example with the success of technical indicators in Iraq we also notice that the buy and hold return over the same time period is negative.
However, Fiji is the exact opposite, it has low success with technical indicators in addition to low buy and hold returns.
Obviously low buy and hold returns ≠ success of technical indicators
This could mean one of two things. Technical indicators are just absolute garbage in the first place and only had optimal returns by chance. Or… there is some unknown correlation at play here which affects the success of technical indicators that is not dependent on buy and hold performance.
This latter conclusion looks more likely if we take a look at the success of technical indicators in Nepal.
One last thing before I wrap up today’s post (and probably the most applicable to any strategy you might come up with). There is a very obvious difference in quality of technical indicator depending on the market that we are looking at. In order to maximize our returns we need to not only look at different technical indicators, but different parameters of the same indicator. If we can look at different “arbitrary” parameters for a technical indicator that has historical evidence of performing well in a specific market we have a better chance our model being tuned effectively.
Anyway, with that said, that wraps up today’s post! Hope you enjoyed it and be sure to comment down below what your thoughts are, I would love to hear them. Have a great rest of your week!
All content is for discussion, entertainment, and illustrative purposes only and should not be construed as professional financial advice, solicitation, or recommendation to buy or sell any securities, notwithstanding anything stated.
There are risks associated with investing in securities. Loss of principal is possible. Some high-risk investments may use leverage, which could accentuate losses. Foreign investing involves special risks, including a greater volatility and political, economic and currency risks and differences in accounting methods. Past performance is not a predictor of future investment performance.
Should you need such advice, consult a licensed financial advisor, legal advisor, or tax advisor.
All views expressed are personal opinion and are subject to change without responsibility to update views. No guarantee is given regarding the accuracy of information on this post
Super interesting article. Learned a lot, think important to note your callout that it's TA based on statistical models and not the 'art form' :)
I'm not well-versed in any but I think always good to keep an open mind and try to absorb as much as possible. Even though this study primarily looks at Asian markets, this includes China, Hong Kong (as a proxy for China), Japan and Australia. All major economies that investors with any global positions will be interested in.
Also reading elsewhere that people are expecting tailwinds for that emerging markets this year, particularly in proximity to China, due to it re-opening its borders, so this article is definitely timely!